Benchmarks
Benchmarks
Section titled “Benchmarks”These measurements compare the R binding and Rust GPU backend; they are shared reference results, not separately measured timings for each binding. Timings depend on hardware, drivers, thread availability, and workload; crossover points are observations from this run, not universal thresholds.
R and CPU Comparison
Section titled “R and CPU Comparison”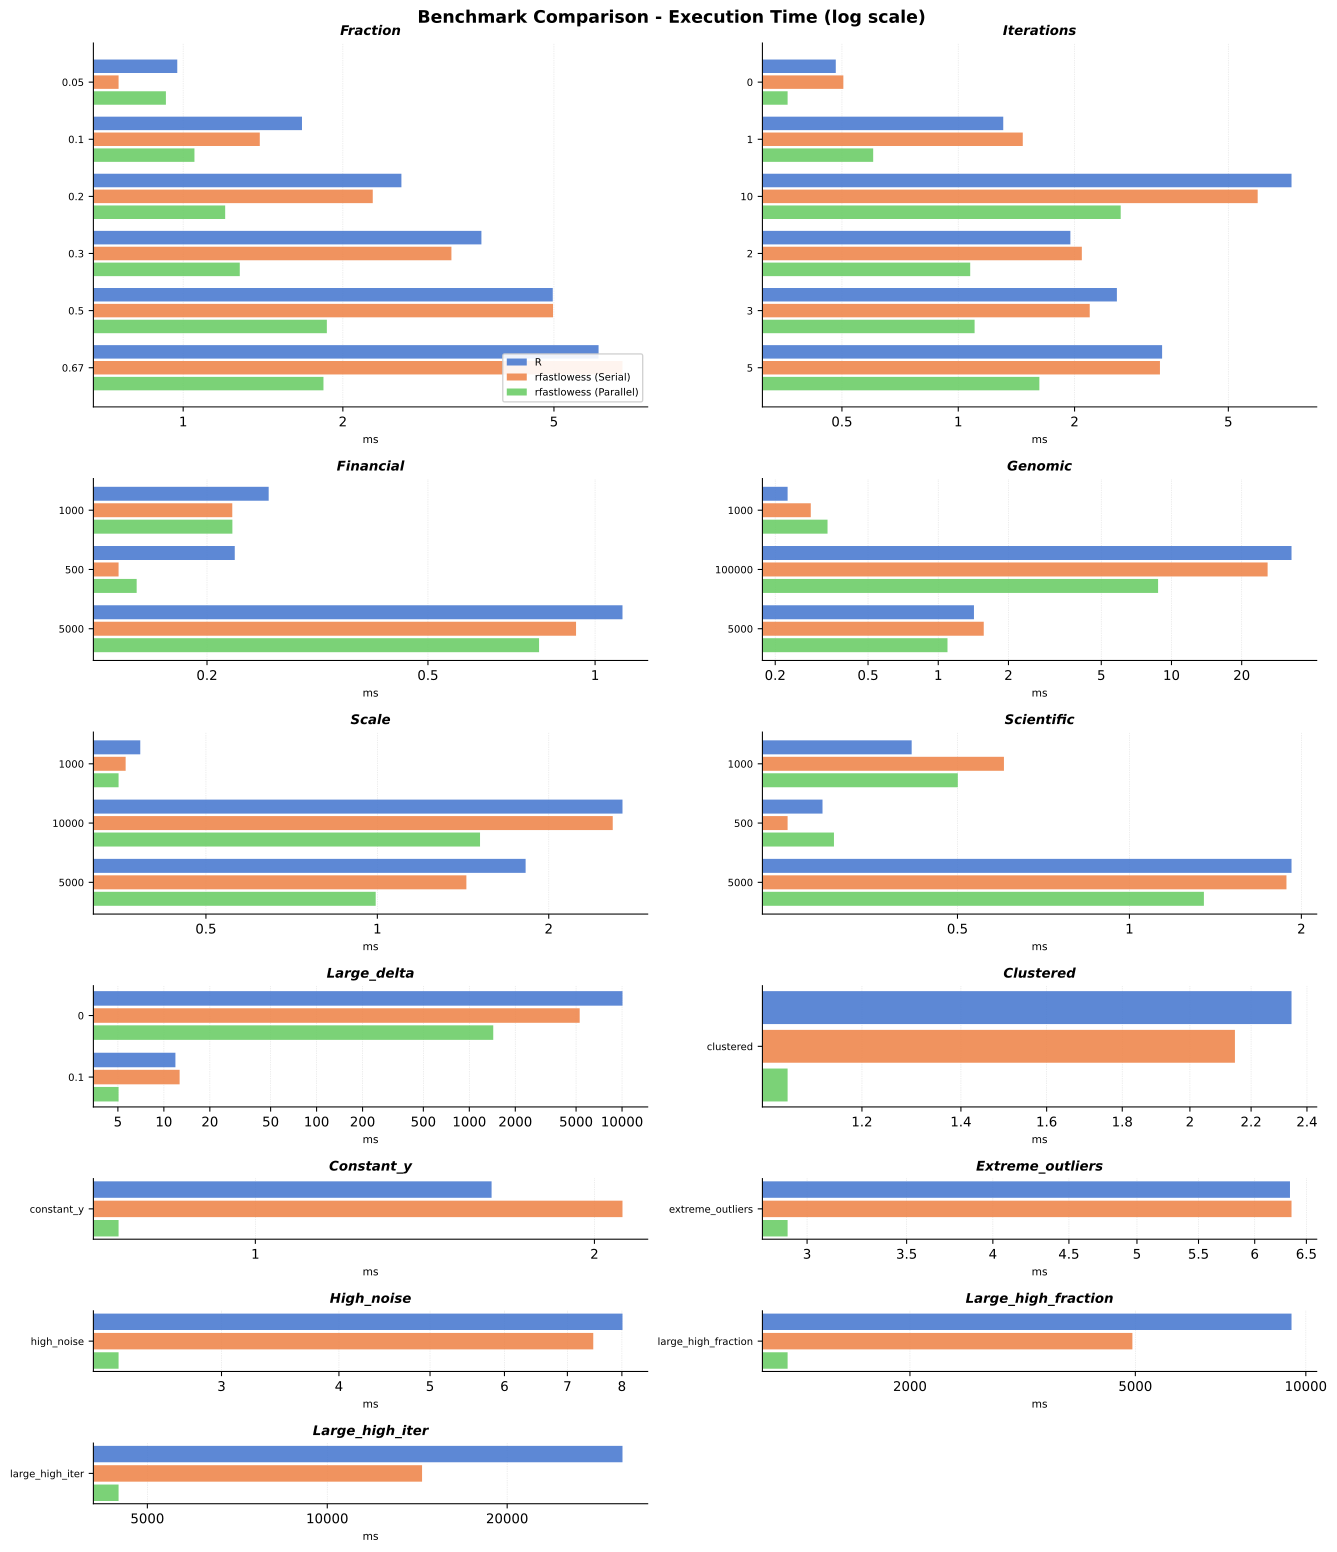
The plot and table use mean CPU timings. Parentheses show speedup relative to stats::lowess; values above 1 indicate faster execution than R.
| Scenario | stats::lowess | rfastlowess (serial) | rfastlowess (parallel) |
|---|---|---|---|
| clustered | 2.34 ms | 2.15 ms (1.1×) | 1.07 ms (2.2×) |
| constant_y | 1.62 ms | 2.12 ms (0.8×) | 0.76 ms (2.1×) |
| extreme_outliers | 6.34 ms | 6.35 ms (1.0×) | 2.91 ms (2.2×) |
| financial_1000 | 0.26 ms | 0.22 ms (1.2×) | 0.22 ms (1.2×) |
| financial_500 | 0.22 ms | 0.14 ms (1.6×) | 0.15 ms (1.5×) |
| financial_5000 | 1.12 ms | 0.92 ms (1.2×) | 0.79 ms (1.4×) |
| fraction_0.05 | 0.97 ms | 0.76 ms (1.3×) | 0.93 ms (1.1×) |
| fraction_0.1 | 1.67 ms | 1.39 ms (1.2×) | 1.05 ms (1.6×) |
| fraction_0.2 | 2.58 ms | 2.28 ms (1.1×) | 1.20 ms (2.1×) |
| fraction_0.3 | 3.65 ms | 3.20 ms (1.1×) | 1.28 ms (2.9×) |
| fraction_0.5 | 4.97 ms | 4.98 ms (1.0×) | 1.87 ms (2.7×) |
| fraction_0.67 | 6.07 ms | 6.73 ms (0.9×) | 1.84 ms (3.3×) |
| genomic_1000 | 0.23 ms | 0.28 ms (0.8×) | 0.34 ms (0.7×) |
| genomic_100000 | 32.71 ms | 25.84 ms (1.3×) | 8.76 ms (3.7×) |
| genomic_5000 | 1.42 ms | 1.57 ms (0.9×) | 1.10 ms (1.3×) |
| high_noise | 8.01 ms | 7.46 ms (1.1×) | 2.33 ms (3.4×) |
| iterations_0 | 0.48 ms | 0.50 ms (1.0×) | 0.36 ms (1.3×) |
| iterations_1 | 1.31 ms | 1.47 ms (0.9×) | 0.60 ms (2.2×) |
| iterations_10 | 7.29 ms | 5.96 ms (1.2×) | 2.63 ms (2.8×) |
| iterations_2 | 1.95 ms | 2.09 ms (0.9×) | 1.07 ms (1.8×) |
| iterations_3 | 2.57 ms | 2.19 ms (1.2×) | 1.10 ms (2.3×) |
| iterations_5 | 3.37 ms | 3.33 ms (1.0×) | 1.62 ms (2.1×) |
| large_delta_0 | 10 067.77 ms | 5 279.61 ms (1.9×) | 1 434.48 ms (7.0×) |
| large_delta_0.1 | 11.90 ms | 12.68 ms (0.9×) | 5.05 ms (2.4×) |
| large_high_fraction | 9 434.85 ms | 4 940.71 ms (1.9×) | 1 216.33 ms (7.8×) |
| large_high_iter | 31 189.44 ms | 14 409.17 ms (2.2×) | 4 475.26 ms (7.0×) |
| scale_1000 | 0.38 ms | 0.36 ms (1.1×) | 0.35 ms (1.1×) |
| scale_10000 | 2.69 ms | 2.59 ms (1.0×) | 1.51 ms (1.8×) |
| scale_5000 | 1.82 ms | 1.43 ms (1.3×) | 0.99 ms (1.8×) |
| scientific_1000 | 0.42 ms | 0.60 ms (0.7×) | 0.50 ms (0.8×) |
| scientific_500 | 0.29 ms | 0.25 ms (1.2×) | 0.30 ms (1.0×) |
| scientific_5000 | 1.92 ms | 1.88 ms (1.0×) | 1.35 ms (1.4×) |
At small sizes, fixed per-call overhead can dominate, and parallel execution is not always faster. The large wide-window workload reaches 7.8× parallel speedup; the high-iteration workload reaches 2.2× serial speedup. Allowing default delta reduces the reference workload from approximately 10.07 s to 11.90 ms.
CPU-Parallel versus GPU
Section titled “CPU-Parallel versus GPU”The first measured input size where GPU median time is below CPU-parallel median time:
| Fraction | 0 robustness iterations | 3 robustness iterations |
|---|---|---|
| 0.1 | 50 000 | 50 000 |
| 0.3 | 50 000 | 50 000 |
| 0.5 | 25 000 | 25 000 |
Selected median timings, with GPU speedup defined as CPU-parallel time divided by GPU time:
| n | Fraction | Iterations | CPU-parallel | GPU | GPU speedup |
|---|---|---|---|---|---|
| 10 000 | 0.5 | 3 | 4.66 ms | 6.31 ms | 0.74× |
| 50 000 | 0.5 | 0 | 7.69 ms | 2.64 ms | 2.92× |
| 100 000 | 0.5 | 3 | 52.40 ms | 24.62 ms | 2.13× |
| 250 000 | 0.3 | 3 | 96.33 ms | 49.14 ms | 1.96× |
| 1 000 000 | 0.5 | 3 | 1 118.35 ms | 236.47 ms | 4.73× |
The GPU is slower for the selected 10 000-point case, but approximately 4.7× faster for the million-point case. Wider windows increase per-query work and can make GPU execution worthwhile at smaller input sizes.
The crossover is the first sampled GPU win, not a guarantee that every larger input favors the GPU. At fraction 0.1, CPU wins again at 100K for both iteration counts.
Full crossover sweep with text charts
fraction=0.1  iterations=0  - first GPU win: 50K       n   CPU (med)   GPU (med)   speedup  chart--------  ----------  ----------  --------  ------------------------      1K     0.06 ms     1.08 ms     0.06×  CPU ▒▒▒▒▒▒▒▒▒▒▒▒▒▒▒▒▒▒▒      2K     0.27 ms     0.97 ms     0.27×  CPU ▒▒▒▒▒▒▒▒▒▒▒▒▒▒▒      5K     0.21 ms     0.87 ms     0.24×  CPU ▒▒▒▒▒▒▒▒▒▒▒▒▒▒▒     10K     0.31 ms     1.73 ms     0.18×  CPU ▒▒▒▒▒▒▒▒▒▒▒▒▒▒▒▒     25K     0.78 ms     2.03 ms     0.38×  CPU ▒▒▒▒▒▒▒▒▒▒▒▒     50K     2.78 ms     2.20 ms     1.26×  GPU █  ◀ crossover    100K     5.52 ms     6.71 ms     0.82×  CPU ▒▒▒▒    250K    23.10 ms    15.10 ms     1.53×  GPU ███    500K    42.44 ms    35.62 ms     1.19×  GPU █      1M    89.78 ms    62.94 ms     1.43×  GPU ██
fraction=0.3  iterations=0  - first GPU win: 50K       n   CPU (med)   GPU (med)   speedup  chart--------  ----------  ----------  --------  ------------------------      1K     0.11 ms     0.74 ms     0.15×  CPU ▒▒▒▒▒▒▒▒▒▒▒▒▒▒▒▒▒      2K     0.30 ms     0.78 ms     0.38×  CPU ▒▒▒▒▒▒▒▒▒▒▒▒      5K     0.36 ms     0.83 ms     0.43×  CPU ▒▒▒▒▒▒▒▒▒▒▒     10K     0.68 ms     1.48 ms     0.46×  CPU ▒▒▒▒▒▒▒▒▒▒▒     25K     1.60 ms     1.83 ms     0.88×  CPU ▒▒     50K     5.14 ms     2.40 ms     2.14×  GPU ██████  ◀ crossover    100K     9.33 ms     5.69 ms     1.64×  GPU ███    250K    30.04 ms    16.16 ms     1.86×  GPU ████    500K    58.62 ms    34.27 ms     1.71×  GPU ████      1M   126.25 ms    69.38 ms     1.82×  GPU ████
fraction=0.5  iterations=0  - first GPU win: 25K       n   CPU (med)   GPU (med)   speedup  chart--------  ----------  ----------  --------  ------------------------      1K     0.23 ms     0.92 ms     0.25×  CPU ▒▒▒▒▒▒▒▒▒▒▒▒▒▒▒      2K     0.30 ms     0.86 ms     0.35×  CPU ▒▒▒▒▒▒▒▒▒▒▒▒▒      5K     0.51 ms     1.56 ms     0.32×  CPU ▒▒▒▒▒▒▒▒▒▒▒▒▒▒     10K     1.10 ms     1.46 ms     0.75×  CPU ▒▒▒▒▒     25K     2.36 ms     1.85 ms     1.27×  GPU █  ◀ crossover     50K     7.69 ms     2.64 ms     2.92×  GPU ██████████    100K    15.81 ms     5.31 ms     2.98×  GPU ██████████    250K    37.61 ms    17.10 ms     2.20×  GPU ██████    500K    80.02 ms    35.82 ms     2.23×  GPU ██████      1M   231.02 ms    70.12 ms     3.29×  GPU ███████████
fraction=0.1  iterations=3  - first GPU win: 50K       n   CPU (med)   GPU (med)   speedup  chart--------  ----------  ----------  --------  ------------------------      1K     0.26 ms     5.04 ms     0.05×  CPU ▒▒▒▒▒▒▒▒▒▒▒▒▒▒▒▒▒▒▒      2K     1.09 ms     4.71 ms     0.23×  CPU ▒▒▒▒▒▒▒▒▒▒▒▒▒▒▒      5K     1.26 ms     4.80 ms     0.26×  CPU ▒▒▒▒▒▒▒▒▒▒▒▒▒▒▒     10K     1.33 ms     5.72 ms     0.23×  CPU ▒▒▒▒▒▒▒▒▒▒▒▒▒▒▒     25K     3.31 ms     6.55 ms     0.51×  CPU ▒▒▒▒▒▒▒▒▒▒     50K     8.19 ms     8.04 ms     1.02×  GPU  ◀ crossover    100K    14.35 ms    16.86 ms     0.85×  CPU ▒▒▒    250K    58.75 ms    43.92 ms     1.34×  GPU ██    500K   113.73 ms    86.19 ms     1.32×  GPU ██      1M   304.22 ms   212.73 ms     1.43×  GPU ██
fraction=0.3  iterations=3  - first GPU win: 50K       n   CPU (med)   GPU (med)   speedup  chart--------  ----------  ----------  --------  ------------------------      1K     0.51 ms     4.96 ms     0.10×  CPU ▒▒▒▒▒▒▒▒▒▒▒▒▒▒▒▒▒▒      2K     1.33 ms     4.70 ms     0.28×  CPU ▒▒▒▒▒▒▒▒▒▒▒▒▒▒      5K     1.80 ms     5.71 ms     0.31×  CPU ▒▒▒▒▒▒▒▒▒▒▒▒▒     10K     2.77 ms     6.09 ms     0.45×  CPU ▒▒▒▒▒▒▒▒▒▒▒     25K     5.73 ms     7.33 ms     0.78×  CPU ▒▒▒▒     50K    15.03 ms     9.70 ms     1.55×  GPU ███  ◀ crossover    100K    27.16 ms    23.23 ms     1.17×  GPU █    250K    96.33 ms    49.14 ms     1.96×  GPU █████    500K   201.04 ms   113.25 ms     1.77×  GPU ████      1M   673.32 ms   192.87 ms     3.49×  GPU ████████████
fraction=0.5  iterations=3  - first GPU win: 25K       n   CPU (med)   GPU (med)   speedup  chart--------  ----------  ----------  --------  ------------------------      1K     0.80 ms     4.57 ms     0.17×  CPU ▒▒▒▒▒▒▒▒▒▒▒▒▒▒▒▒▒      2K     1.34 ms     5.03 ms     0.27×  CPU ▒▒▒▒▒▒▒▒▒▒▒▒▒▒      5K     2.43 ms     5.95 ms     0.41×  CPU ▒▒▒▒▒▒▒▒▒▒▒▒▒     10K     4.66 ms     6.31 ms     0.74×  CPU ▒▒▒▒▒     25K     9.19 ms     7.37 ms     1.25×  GPU █  ◀ crossover     50K    23.77 ms    12.99 ms     1.83×  GPU ████    100K    52.40 ms    24.62 ms     2.13×  GPU ██████    250K   123.11 ms    55.82 ms     2.21×  GPU ██████    500K   394.26 ms   139.10 ms     2.83×  GPU █████████      1M  1118.35 ms   236.47 ms     4.73×  GPU ███████████████████
End-to-End GPU Fit
Section titled “End-to-End GPU Fit”Recorded wall-clock timings for the complete Rust GPU workload:
| n | Mean | Median | Minimum | Maximum |
|---|---|---|---|---|
| 1 000 | 6.091 ms | 6.512 ms | 4.710 ms | 7.170 ms |
| 5 000 | 5.162 ms | 5.136 ms | 4.344 ms | 5.957 ms |
| 10 000 | 6.548 ms | 6.606 ms | 4.904 ms | 8.548 ms |
| 50 000 | 7.565 ms | 7.376 ms | 7.172 ms | 8.352 ms |
| 100 000 | 14.170 ms | 14.396 ms | 12.213 ms | 16.029 ms |
| 500 000 | 63.544 ms | 63.831 ms | 61.600 ms | 64.527 ms |
| 1 000 000 | 141.224 ms | 141.413 ms | 137.718 ms | 143.109 ms |
Small workloads have a substantial fixed setup cost. Beyond those sizes, runtime grows with the amount of fitting work.
Host/Device Transfer Overhead
Section titled “Host/Device Transfer Overhead”Mean transfer latencies and effective bandwidth from the isolated transfer benchmark. Round-trip bandwidth uses the combined uploaded/downloaded bytes divided by mean round-trip time:
Transfer measurements used an Intel Arc 140V integrated GPU (16 GB) with the Vulkan backend.
| n | Upload | Download | Round trip | Effective bandwidth |
|---|---|---|---|---|
| 1 000 | 0.361 ms | 0.399 ms | 0.760 ms | 0.026 GB/s |
| 5 000 | 0.404 ms | 0.403 ms | 0.807 ms | 0.124 GB/s |
| 10 000 | 0.440 ms | 0.506 ms | 0.946 ms | 0.212 GB/s |
| 50 000 | 0.426 ms | 0.326 ms | 0.751 ms | 1.331 GB/s |
| 100 000 | 0.730 ms | 0.853 ms | 1.583 ms | 1.263 GB/s |
| 500 000 | 1.922 ms | 2.212 ms | 4.134 ms | 2.419 GB/s |
| 1 000 000 | 3.662 ms | 4.295 ms | 7.957 ms | 2.514 GB/s |
Fixed transfer latency dominates the smaller buffers; effective bandwidth reaches approximately 2.5 GB/s for the largest recorded transfer. These measurements isolate transfer operations, so they should not be subtracted directly from timings collected by a different fit benchmark.
The transfer-fraction report uses rfastlowess_parallel.json, which is a CPU reference, not an end-to-end GPU measurement. Its 216.4% fraction and negative kernel time are therefore not valid GPU timing results and are omitted here.