Usage
# S3 method for class 'LowessResult'
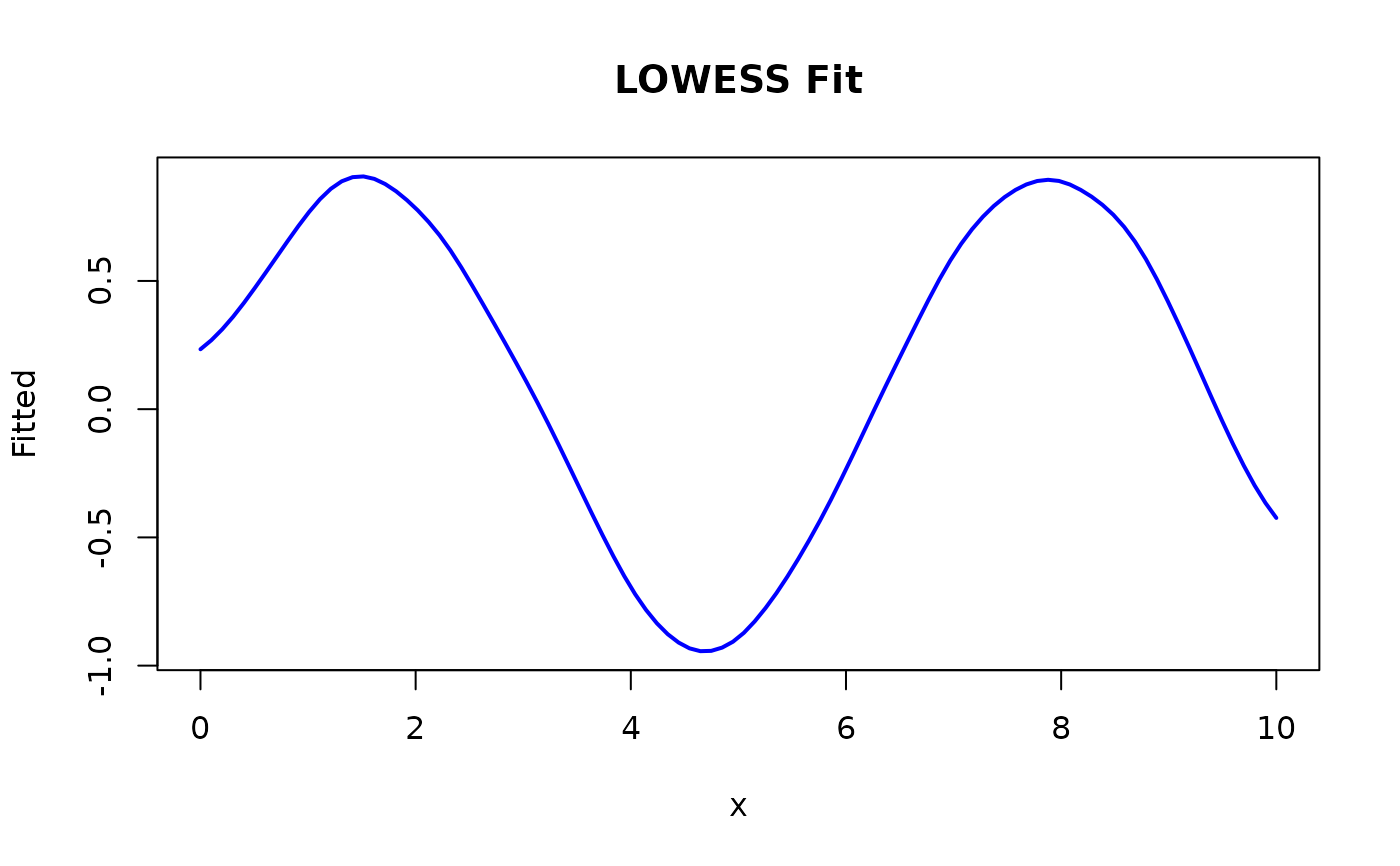
plot(x, main = "LOWESS Fit", ...)
Arguments
- x
A LowessResult object.
- main
Plot title.
- ...
Additional arguments passed to plot() and lines().
Value
NULL, invisibly. Called for side effects (plotting).
Examples
x <- seq(0, 10, length.out = 100)
y <- sin(x) + rnorm(100, 0, 0.1)
model <- Lowess(fraction = 0.2)
res <- fit(model, x, y)
plot(res)