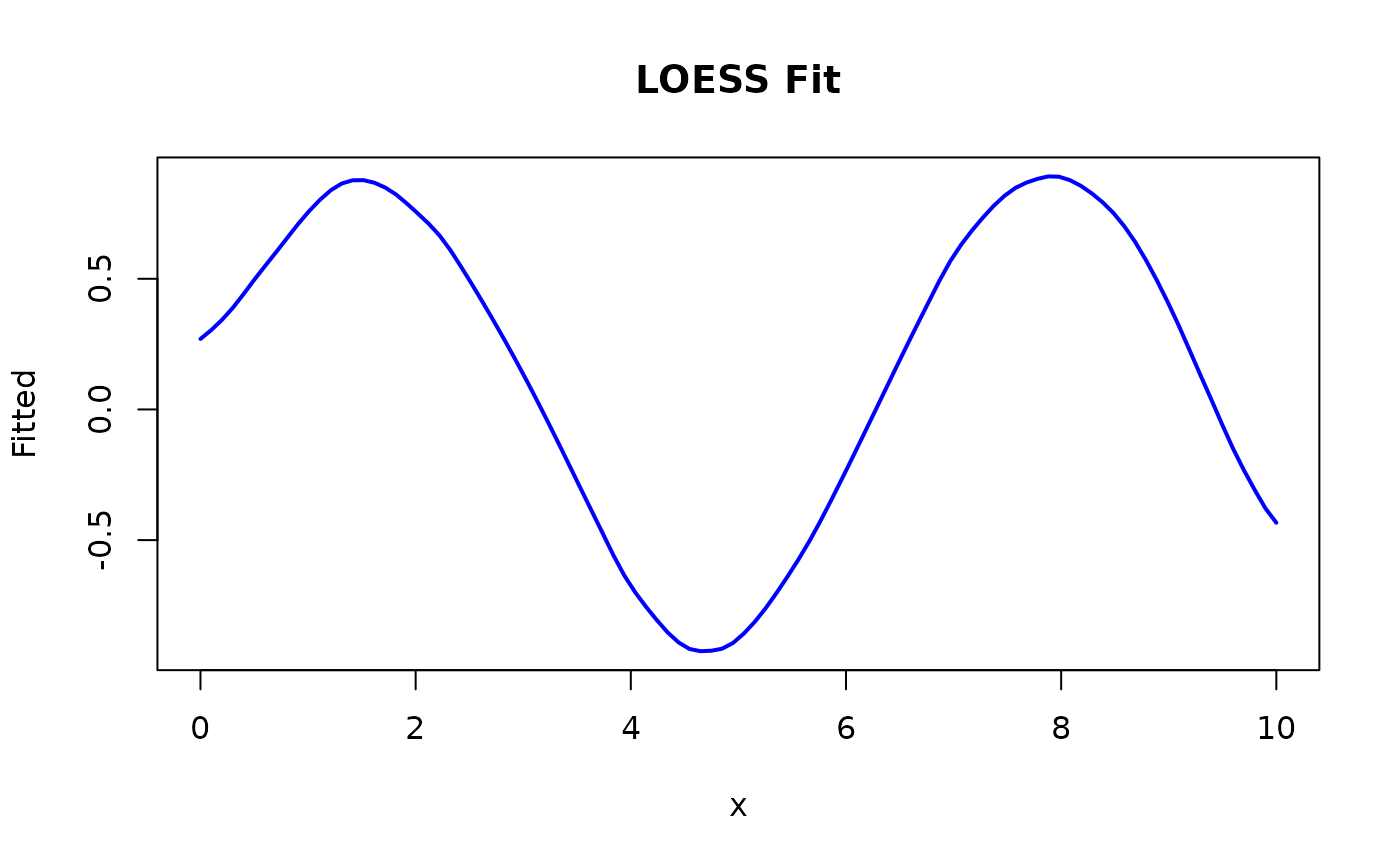
Plotting supports one-dimensional results. For a multivariate fit, select a predictor dimension and create a custom plot.
Usage
# S3 method for class 'LoessResult'
plot(x, main = "LOESS Fit", ...)Plotting supports one-dimensional results. For a multivariate fit, select a predictor dimension and create a custom plot.
# S3 method for class 'LoessResult'
plot(x, main = "LOESS Fit", ...)